

High Bandwidth Memory capacity is absorbing conventional silicon at unprecedented speed: TrendForce projects that HBM wafer input among the top three suppliers will account for approximately 18%, 22%, and 30% of total DRAM wafer input at the end of 2025, 2026, and 2027 respectively. TrendForce’s forecasts indicate that even with HBM consuming about 22% of DRAM wafer input by end-2026, it will account for only about 9% of total DRAM bit supply, reflecting the manufacturing complexity and yield overhead of multi‑layer die stacking. This stark conversion gap is sustaining elevated pricing power across the memory tier. While SK hynix maintains qualitative leadership in the 2026 market, Samsung is regaining ground through early HBM4 validation and targeting about 38% market share by year-end, while Micron focuses aggressive expansion primarily on HBM3e. For UK infrastructure teams, this upstream dynamic directly dictates accelerator hardware quotes and platform delivery schedules.
View the data behind this chart
| End-2025 | End-2026 | End-2027 | |
|---|---|---|---|
| Wafer Input Share | %18 | %22 | %30 |
| Bit Supply Share | %8 | %9 | %13 |
HBM Market Share Dynamics in Mid-2026: The Supplier Balance
The competitive structure of the High Bandwidth Memory market in mid-2026 is defined by an aggressive realignment among SK hynix, Samsung, and Micron. TrendForce's industry analysis confirms that SK hynix maintained overall leadership in the HBM market through the first half of 2026, building on its early dominance in high-density stacks. However, Samsung has mounted a significant recovery across 2026, driven by expanding contributions from both HBM3e and early HBM4 shipments. TrendForce reports that Samsung is targeting an HBM market share of approximately 38% by year-end 2026.
Micron represents the third major pillar of the supplier landscape, expanding aggressively across 2026. However, Micron’s shipment profile remains heavily weighted toward HBM3e, leaving the initial high-volume HBM4 battlefield largely contested between Samsung and SK hynix. The divergence in supplier roadmaps means that headline DRAM output no longer reflects High Bandwidth Memory availability; tracking enterprise hardware costs requires examining HBM-specific wafer allocation.
For enterprise engineering teams looking to understand what High Bandwidth Memory (HBM) is and how it interacts with processing silicon, the structural takeaway in 2026 is concentration. Production remains entirely dependent on three vendors whose yield ramps and qualification milestones directly determine global accelerator shipments.
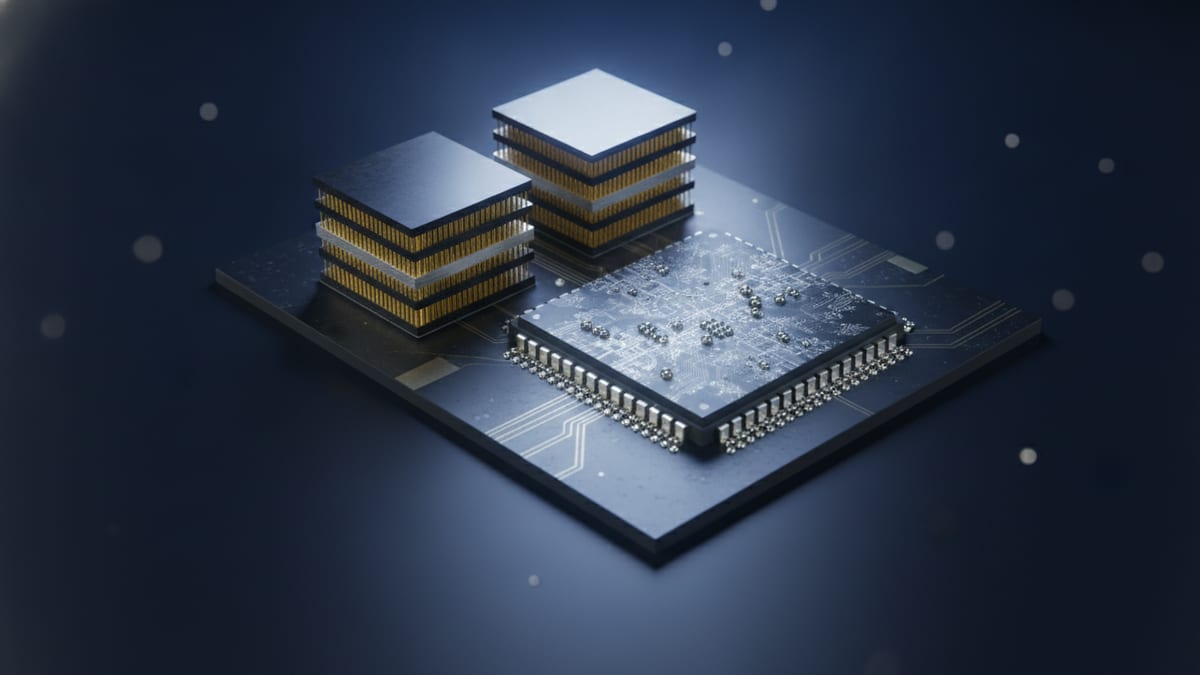
Capacity Allocation: Wafer Input vs Bit Supply Metrics
A critical distortion in the memory industry throughout 2026 is the growing divergence between wafer consumption and finished bit supply. Stacking DRAM dies via Through-Silicon Vias (TSV) introduces substantial processing overhead and yield loss compared to planar DDR5 production. TrendForce data reveals that by the end of 2026, HBM will consume approximately 22% of all DRAM wafer starts among the top three manufacturers, up from 18% at the end of 2025. By the end of 2027, this figure is forecast to reach 30%.
Despite consuming nearly a quarter of all production wafers by late 2026, HBM will account for only about 9% of total DRAM bit supply, compared to 8% at the end of 2025 and a projected 13% at the end of 2027. This 13-percentage-point gap between wafer input (22%) and bit output (9%) illustrates why the HBM shortage continues to exert upward pressure on memory supply chains.
Because HBM absorbs disproportionate clean-room footprint and advanced lithography capacity, standard server DRAM lines cannot easily backfill shortfalls. This structural squeeze is a primary driver behind AI infrastructure price inflation, compounding procurement cycles across hyperscale and on-premises deployments.
HBM3e to HBM4: Certification Timelines and Ramping Friction
According to TrendForce’s 2Q26 market dynamics, the HBM4 ramp accelerated in 2026, with Samsung entering mass production in early 2026. TrendForce noted that Samsung was first to complete HBM4 validation and begin commercial shipments during the second quarter of 2026, driving its rapid recovery in market standing.
Conversely, SK hynix encountered friction during its initial transition. TrendForce reported that SK hynix’s HBM4 mass production schedule was pushed to 3Q26 due to interface synchronisation issues, although SK hynix stated on its Q2 2026 earnings call that initial HBM4 mass production shipments commenced in Q2 2026 with a broader ramp planned for the second half of the year. TrendForce highlighted that this variance in HBM4 certification timelines has actively reshaped supplier market shares during 2026.
Meanwhile, Micron’s HBM4 shipment trajectory underwent only slight revisions because the company deliberately kept its manufacturing capacity concentrated on fulfilling high-volume HBM3e demand. As system designers evaluate GPU accelerators that utilise HBM, memory generation timing directly influences system lead times and platform availability.
Supplier Financials and Capital Expenditure Commitments
The financial scale required to sustain HBM leadership is demonstrated in recent earnings disclosures. SK hynix reported record financial results for Q2 2026, generating revenue of KRW 79.3 trillion and an operating income of KRW 60.5 trillion, underscoring the exceptional profitability of high-density memory stacks.
To protect its position and address interface synchronisation and scaling challenges, SK hynix outlined substantial capital investments. The company confirmed that its 2026 capex will reach the high KRW 40 trillion range. This expenditure is driven by the acceleration of the M15X fab and preparations for expanded manufacturing once the clean-room at Yongin Phase 1 opens in early 2027.
These multi-trillion-won capital cycles highlight that HBM is no longer an auxiliary memory product, but the central balance-sheet driver for memory fabricators. However, because fab expansions such as Yongin Phase 1 will not yield production volume until 2027, capacity additions through the remainder of 2026 rely entirely on optimising yields across existing fab lines.
The UK Enterprise Angle: AI Server Pricing and Infrastructure Sizing
For UK enterprise IT buyers and data centre operators, HBM market dynamics rarely surface as an explicit component line item on an invoice. Instead, the cost is embedded directly into high-density AI accelerators, server nodes, and complete cluster configurations. With HBM wafer allocation reaching 22% of DRAM capacity, the ongoing memory crunch feeds directly into volatility for compute hardware quotes throughout 2026.
UK organisations face specific compounding factors, notably currency exposure when dollar-denominated silicon quotes are converted to sterling amidst shifting exchange rates with USD and KRW. A mid-sized UK research lab or enterprise deploying a 64-GPU training cluster in mid-2026 must account for the reality that the memory subsystem represents a primary vulnerability for lead times. If a chosen accelerator family relies on HBM4 silicon subject to qualification adjustments, platform delivery can experience multi-month delays.
Organisations planning hardware refreshes should model these constraints early. Leveraging a dedicated AI GPU sizing calculator allows procurement teams to balance memory density against realistic delivery timelines, avoiding over-committing to early-production nodes when volume-ramped HBM3e configurations can meet workload requirements with lower lead-time risk.
View the data behind this chart
| Wafer Share (%) | End-2025 | End-2026 | End-2027 |
|---|---|---|---|
| Wafer Input % | 18 | 22 | 30 |
Procurement Strategy: Mitigating Allocation Bottlenecks
Given that HBM4 certification timing differences continue to alter market share and delivery commitments, UK IT leaders must adapt their infrastructure procurement playbooks to avoid costly project stalling.
Procurement teams must recognize that a quote from an OEM does not guarantee silicon allocation. Systems incorporating leading-edge memory should be cross-referenced against confirmed supplier validation milestones. If an accelerator relies on memory stacks that faced interface synchronisation delays, delivery expectations must be adjusted accordingly.
Organisations must also evaluate their workload profiles to determine whether early-adoption HBM4 systems justify the allocation premium over stabilized HBM3e platforms. Careful assessment of compute versus memory constraints during server configuration ensures that budgets are allocated efficiently without paying unneeded premiums for scarce components.
- •Audit accelerator bills of materials to identify whether systems rely on early-wave HBM4 or mature HBM3e memory stacks.
- •Account for foreign exchange volatility across GBP, USD, and KRW when securing hardware pricing locks on long-lead clusters.
- •Maintain dual-track platform configurations to mitigate vendor-specific qualification or yield delays.
- •Plan multi-node infrastructure deployments around verified packaging and delivery dates rather than initial manufacturer roadmap announcements.
Methodology
This data study compiles and synthesises public market disclosures, industry research bulletins, and corporate earnings reports covering the high-bandwidth memory sector as of mid-2026. Primary market metrics—including DRAM wafer input shares, bit supply shares, supplier qualification milestones, and market share targets—were sourced directly from research publications released by TrendForce between February and August 2026.
Corporate financial metrics, capital expenditure forecasts, and manufacturing roadmap disclosures were verified against SK hynix’s Q2 2026 earnings conference call disclosures (July 2026). Data points were validated by cross-referencing industry analysis with official vendor disclosures to ensure strict scope integrity. Metric scopes—such as the distinction between wafer input allocation and finished bit supply—were preserved without extrapolation or statistical aggregation.
All data points are reported as of 7 September 2026, based on sources available at the time of writing. The findings examine the operational and commercial impact of memory tier bottlenecks specifically as they apply to enterprise technology procurement and datacentre deployments within the UK.
Sources
Every figure in this article traces to the sources below.
- •TrendForce — HBM Wafer Input and Bit Supply Forecast 2025-2027
- •TrendForce — 1Q26 HBM Industry Analysis
- •TrendForce — 2Q26 HBM Market Dynamics Note
- •TrendForce — 2Q26 HBM Market Bulletin on HBM4 Certification
- •TrendForce — Samsung HBM4 Validation and Market Share Target Report
- •SK hynix — Q2 2026 Earnings Call Transcript and Capex Guidance
View the data behind this chart
| Vendor | HBM4 Status | Strategic Focus | |
|---|---|---|---|
| Samsung | Samsung | Shipped 2Q26 | Targeting ~38% share |
| SK hynix | SK hynix | Ramp in 3Q26 | M15X & Yongin Phase 1 |
| Micron | Micron | Slight revision | Concentrated on HBM3e |
The 10 data points behind this study are free to download, each with its source. The figures belong to those sources: cite the named source and check its terms before reusing a figure.
Cite as: Servnet Research, “HBM Market Share Tracker 2026: Supply, Share and Pricing”, servnetuk.com, 2026.
Servnet Research publishes dated observations from public sources for information only. It is not legal, security, financial or investment advice, and data are provided without warranty. Figures from named sources belong to those sources. Spotted an error, or want something corrected or removed? See our corrections and takedown policy.