
Mid-2026's all-flash shootout isn't about who posts the biggest IOPS number — it's about who delivers the lowest genuine price-per-effective-terabyte once support, lifecycle and data-reduction guarantees are stripped of marketing gloss. Dell's PowerStore Elite claims it can pack up to 5.8 PB effective capacity into 3U under a 6:1 data-reduction guarantee, a density claim that would reshape rack and cooling planning if it holds on your data. Pure counters with a fleet-wide average Total Efficiency rate above 10:1, while NetApp's Keystone model sits deliberately in the cost middle ground. This piece works through what these guarantees actually mean, how UK IT leaders should validate them, and which of the four leading platforms — Pure, NetApp, Dell PowerStore and HPE Alletra — deserves a place on your 2026 shortlist.
View the data behind this chart
| Pure FlashArray | NetApp AFF (SAN) | Dell PowerStore Gen 3 | Dell PowerStore Elite | |
|---|---|---|---|---|
| Guaranteed reduction ratio | :15 | :14 | :16 | :16 |
The mid-2026 landscape: why 'fastest' is the wrong question
A June 2026 PeerSpot roundup, based on user sentiment rather than lab testing, put Dell PowerStore, Pure FlashArray, NetApp AFF, HPE Alletra Storage and Dell PowerMax as the top five all-flash platforms by user mindshare. That list is a useful current signal of who UK buyers are actually shortlisting in 2026, but it says nothing about which array will actually cost less per effective terabyte on your workload, or which lifecycle model will least disrupt your operations over five years.
That's the frame this article uses. Rather than chasing spec-sheet superlatives, we compare the three levers that genuinely move the needle for a UK mid-market buyer: the data-reduction guarantee a vendor will actually put in a contract, the lifecycle and refresh model wrapped around the hardware, and how each platform's advanced data services map onto UK ransomware and compliance expectations.

Performance benchmarking reality check: there is no clean apples-to-apples table
Be sceptical of any 2026 comparison that presents a single normalised IOPS/latency/throughput table across Pure, NetApp and Dell — vendors test on different block sizes, queue depths and workload mixes, and independently verified, identically-configured benchmark data isn't publicly available. What PeerSpot's June 2026 ranking actually captures is user sentiment among people running these arrays, not a controlled lab result, and it should be read that way.
Vendors also make competing efficiency and density claims that pull in opposite directions. NetApp's own direct-flash comparison argues there is no density advantage for direct flash modules over standard SSDs among currently shipping models, and separately claims Pure systems draw more power than comparable NetApp configurations in its side-by-side testing. Both claims come from a NetApp vendor blog, so treat them as competitive positioning rather than neutral validation — and ask for a proof-of-concept on your own workload before accepting either vendor's framing.
Data reduction guarantees decoded: what 5:1, 4:1/1.5:1 and 6:1 really mean
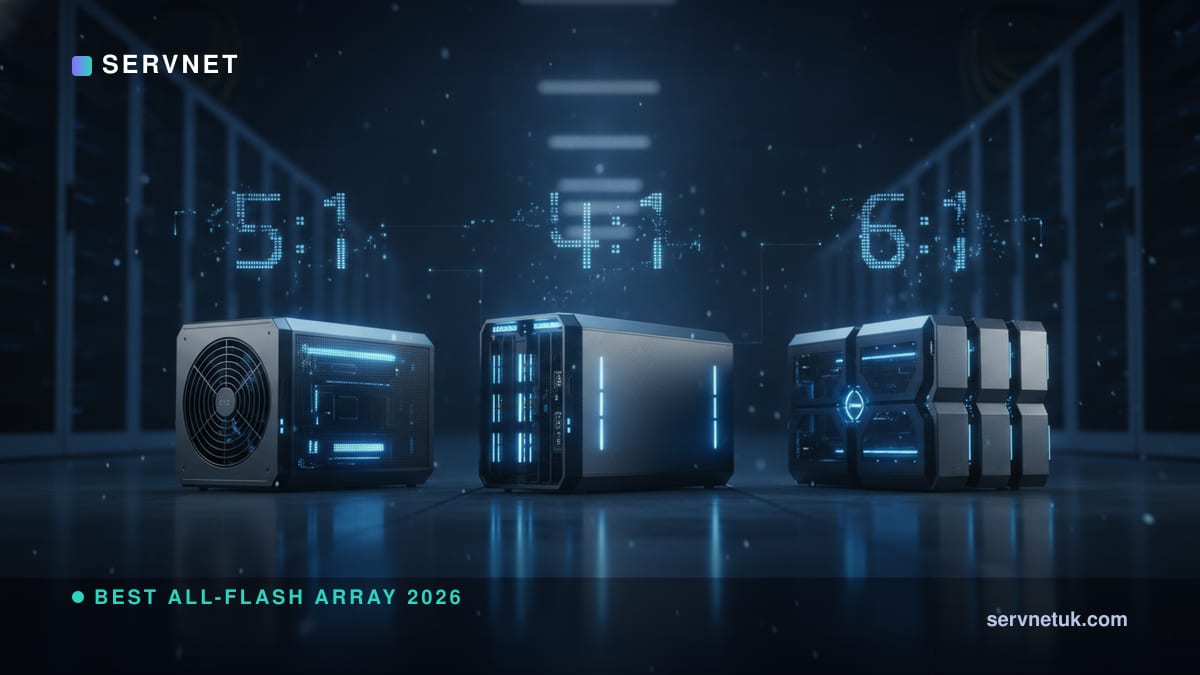
Each vendor publishes a contractual data-reduction guarantee, but the scopes differ enough that a straight ratio comparison is misleading. Pure Storage guarantees 5:1 for FlashArray based on deduplication and compression. NetApp guarantees 4:1 for SAN workloads and separately 1.5:1 for NAS — two different numbers for two different protocols, not one blended figure. Dell states a 6:1 data-reduction guarantee for PowerStore Gen 3, and its PowerStore Elite configuration is marketed as reaching up to 5.8 PB effective capacity in 3U under that same 6:1 guarantee — an effective-capacity density claim under Dell's stated assumptions, not a raw-capacity figure.
Beyond the contractual guarantees, vendors also cite fleet-level averages that are a different kind of number entirely. Pure says its FlashArray fleet delivers a global average Total Efficiency rate greater than 10:1 across deployed systems — an observed average, not the 5:1 figure it guarantees in a contract. Pure's own blog separately claims customers typically see roughly 2x better data reduction than legacy retrofitted arrays because reduction is engineered to be always-on rather than bolted on. NetApp, for its part, claims in its own comparison material that the AFF A-Series delivers 10% greater storage efficiency than Pure FlashArray//X and //XL before additional efficiency technologies are applied — a claim from NetApp's own material measured against specific Pure models, not an independent benchmark.
- •Pure FlashArray: 5:1 guaranteed (dedupe + compression); >10:1 average across the deployed fleet
- •NetApp AFF: 4:1 guaranteed for SAN; 1.5:1 guaranteed for NAS — protocol-specific, not one number
- •Dell PowerStore Gen 3: 6:1 guaranteed; PowerStore Elite markets up to 5.8 PB effective in 3U under that guarantee
Worked example: turning a guarantee ratio into effective capacity
The practical way to use these guarantees is as a multiplier on physical capacity, not as a marketing headline. If a vendor guarantees 6:1, every 1 TB of physical flash is contractually expected to hold roughly 6 TB of your reduced data once dedupe, compression and thin provisioning are applied — which is exactly how Dell frames PowerStore Elite's claim of up to 5.8 PB effective capacity from a 3U enclosure. On Pure's 5:1 guarantee, the same physical footprint yields a smaller effective number on paper, though Pure's argument is that its always-on architecture pushes the achieved ratio closer to its fleet-wide 10:1 average in practice.
For a database-heavy mid-market estate — the classic SQL Server or Oracle consolidation project — the sizing exercise should start with your own compressibility and change-rate profile rather than any vendor's stated ratio. Ask each vendor to run their sizing tool against a representative sample of your actual data, not a synthetic dataset, and get the resulting effective-capacity number written into the commercial proposal rather than left as a marketing guarantee that only applies in the abstract.
UK TCO and lifecycle economics: Evergreen, Keystone and traditional CAPEX
The lifecycle model wrapped around the hardware is where UK procurement teams see the biggest swing in real cost. In a UK-specific 2026 comparison, Dell PowerStore 3200T on a traditional CAPEX-plus-ProSupport model came out with the lowest 5-year list price, 15-25% lower than the compared alternatives — a channel-specific UK figure, not a universal market price, but a useful signal that Dell's midrange list pricing is genuinely competitive in this segment.
Pure takes a different approach: its Evergreen//Forever subscription model includes controller swaps in place every 3-5 years as standard, and the same UK comparison modelled Pure FlashArray //X20 under Evergreen//Forever as reaching zero refresh cost over five years — because the forklift refresh event that CAPEX buyers budget for separately is folded into the subscription. NetApp's AFF A50 on Keystone was positioned in that same comparison as the middle of the pack on the subscription-versus-CAPEX trade-off, neither the cheapest nor the most disruptive option.
The practical takeaway for a UK buyer building a 3- or 5-year business case: don't compare list prices in isolation. Compare what happens at the refresh point — Dell's lower upfront number assumes you'll separately budget for a hardware refresh, while Pure's subscription bakes that event into the ongoing cost, and NetApp's Keystone sits between the two. If you're weighing entry-level configurations against this backdrop, it's worth using a tool to compare entry-level all-flash arrays side by side, and for PB-scale consolidation projects the equivalent exercise to compare high-end all-flash arrays is just as important before you commit to a lifecycle model.
View the data behind this chart
| Layer | Detail |
|---|---|
| Hardware & controllers | Upfront purchase or subscribed capacity cost |
| Data-reduction & software licensing | Determines your real effective £/TB |
| Support & subscription terms | ProSupport, Evergreen or Keystone terms |
| Refresh & controller-swap events | Every 3-5 years under Evergreen model |
Advanced data services: ransomware resilience and UK compliance
For UK boards and cyber insurers, the storage conversation in 2026 has shifted from raw efficiency to demonstrable ransomware resilience: built-in anomaly detection, immutable snapshots, and — critically — tested, timed operational recovery, not just the theoretical existence of a snapshot feature. When evaluating Pure, NetApp or Dell for a UK deployment, push each vendor for evidence of recovery testing against your own retention policy, not a generic feature list, and map that evidence directly to your UK GDPR operational recovery obligations and NCSC-aligned backup-and-recovery practice.
This matters because data-reduction and snapshot features are increasingly used to justify smaller physical footprints and longer retention windows — which is exactly where guarantee validation and ransomware recovery testing intersect. A platform that hits its data-reduction guarantee but can't demonstrate a clean, timed recovery from an immutable snapshot hasn't actually reduced your risk, whatever the efficiency numbers say.
Environmental impact: read vendor power and density claims with a skeptic's eye
Power, cooling and rack density claims in this market are almost entirely vendor-sourced, and the two available data points in 2026 point in different directions depending on who's talking. NetApp's own direct-flash blog argues there is no density advantage for direct flash modules over SSDs among currently shipping models, and separately claims Pure systems consume more power than comparable NetApp systems in its own side-by-side comparison — both are NetApp's positioning, not independently audited lab results. Dell, meanwhile, markets PowerStore Elite's density in effective rather than raw terms, claiming up to 5.8 PB effective in a 3U footprint under its 6:1 guarantee.
The sensible move for a UK data-hall planning exercise is to request actual power-draw and thermal figures under load for your specific configuration from each vendor during procurement, rather than relying on any single vendor's comparative blog post — and to weight those figures against your own PUE and rack-space costs, which vendor marketing never accounts for.
The verdict: our 2026 recommendation by buyer profile
There is no single "best" all-flash array in 2026 — there's a best fit for your priorities. If your primary constraint is 5-year list price and you're comfortable managing a discrete refresh event, Dell PowerStore 3200T's 15-25% lower list-price position in UK comparisons makes it the strongest CAPEX-driven choice for mid-market buyers. If your priority is minimising operational disruption and refresh risk over the full lifecycle, Pure's Evergreen//Forever model — with controller swaps folded in every 3-5 years and a modelled zero refresh cost for the X20 — is built precisely for that outcome. If you need unified block-and-file data services and want a deliberately middle-ground cost position rather than an extreme on either end, NetApp AFF on Keystone is the pragmatic choice.
HPE Alletra Storage's appearance alongside these three in PeerSpot's June 2026 top-five user-sentiment ranking means it deserves a place on your longlist even though this piece doesn't have deep vendor data to compare it directly — worth a proof-of-concept if your shortlist has room for a fourth contender. Whichever direction you lean, don't sign on guarantee ratios alone: run each vendor's sizing tool against your real data, get the effective-capacity number written into the contract, and use a storage end-of-life checker against your current estate before finalising the lifecycle model. If you're still narrowing the field, a structured way to find your ideal storage solution is a faster route to a shortlist than working through vendor decks alone.
Sources
Every figure in this article traces to the sources below.
- •TechnologyMatch — vendor data-reduction guarantees (Pure 5:1, NetApp 4:1 SAN/1.5:1 NAS, Dell 6:1)
- •Intelligent Visibility — PowerStore Elite effective capacity and guarantee claim
- •NetApp — AFF A-Series vs Pure FlashArray efficiency comparison PDF
- •EverPure Data — Pure FlashArray fleet-wide Total Efficiency rate
- •Pure Storage blog — data-reduction philosophy vs NetApp
- •Servnet UK — Dell/Pure/NetApp 2026 UK buyer's guide (lifecycle and pricing positioning)
- •PeerSpot — June 2026 all-flash storage user-sentiment ranking
- •NetApp blog — direct flash vs SSD density and power claims